New Wheels Data Analysis Using SQL
Data Analysis Using SQL for New Wheels Manufacturer
Libraries:
- SQL
- Microsoft Excel
View the Project on GitHub SindujaSivan/NewWheelsDataTransformationUsingSQL
Overview
The New-Wheels Data Transformation project aimed to address the challenges faced by the New-Wheels app, focusing on sales descent, reputation hit, and a drop in new customers.
Objective:
- Provide actionable insights for informed decision-making.
- Identify avenues for business enhancement.
Business Context:
- Universal Desire: People worldwide crave vehicle ownership for mobility freedom.
- Affordable Mobility: Pre-owned vehicles gaining popularity for cost-effectiveness.
- After-sales Assurance: Concerns about resale vendor service addressed by New-Wheels app.
- End-to-end Experience: New-Wheels app—from listing to doorstep delivery—ensures a seamless process.
- Customer-centric: App captures valuable after-sales feedback, prioritizing satisfaction.
Data Input:
The input data includes information related to city, country, customer, product, shipper, order, etc.
 Picture reference: [Project Internal]
Project Insights
1. Financial Overview
- Total Revenue: $83.12M over four quarters
- Total Orders: 1000
- Total Customers: 994
- Average Rating: 3.135
- Last Quarter Revenue: $15.28M
- Last Quarter Orders: 199
- Average Days to Ship: 97.96
- % Good Feedback: 44.10%
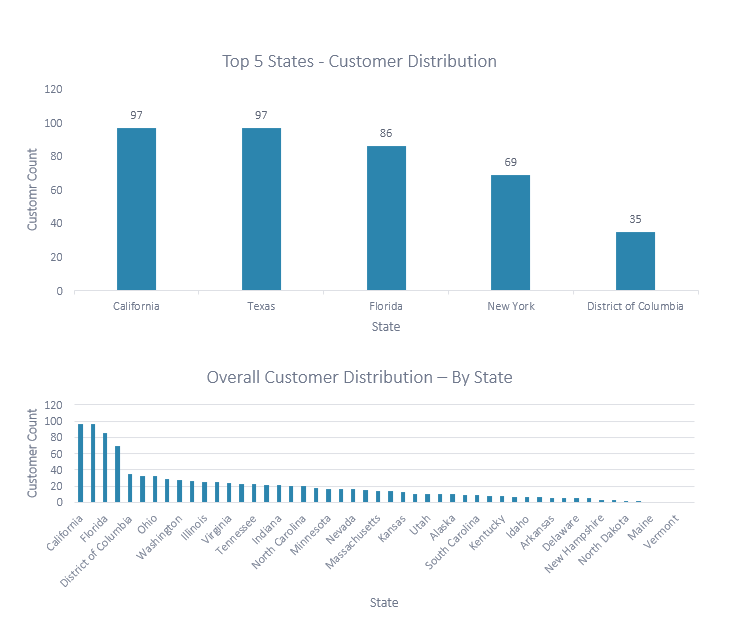
2. Customer Distribution Across States
- California and Texas have the highest customer distribution (97 each).
- Florida has 86 customers, indicating a robust market presence.
- District of Columbia has a relatively high customer count (35).
- States like Vermont, Maine, and North Dakota have low customer distribution, indicating potential areas for market expansion.
- Ohio, Washington, and Illinois have significant customer bases, suggesting opportunities for business expansion.
 Picture reference: [Project Microsoft Excel Report]
3. Average Customer Rating – By Quarter
- Average rating exhibits a consistent decline over the four quarters, indicating potential issues with customer satisfaction or product/service quality.
- The most substantial decline is observed between the first quarter (3.55) and the fourth quarter (2.40).
 Picture reference: [Project Microsoft Excel Report]
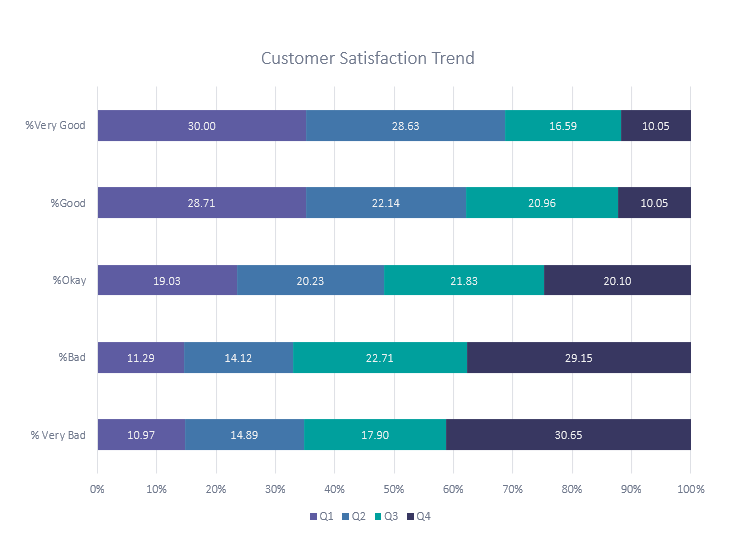
4. Trend of Customer Satisfaction
- Noticeable shift in customer sentiment, with a significant increase in ‘Very Bad’ and ‘Bad’ responses.
- Quarter 4 shows a considerable increase in ‘Very Bad’ responses (30.65%), indicating a decline in customer satisfaction.
- Decrease in responses in ‘Okay’ and ‘Good’ categories, emphasizing the need for comprehensive analysis.
5. Top Vehicle Makers Preferred by Customers
- Chevrolet has the highest total customer count (83), indicating a strong market presence.
- Ford, Toyota, Pontiac, and Dodge follow closely.
- Competitive landscape observed between Toyota, Pontiac, and Dodge.
Code Snippet: Top 5 Vehicle Makers by Total Customers
SELECT PRODUCT_T.VEHICLE_MAKER, COUNT(ORDER_T.CUSTOMER_ID) AS TOTAL_CUSTOMERS
FROM ORDER_T, PRODUCT_T
WHERE ORDER_T.PRODUCT_ID = PRODUCT_T.PRODUCT_ID
GROUP BY PRODUCT_T.VEHICLE_MAKER
ORDER BY TOTAL_CUSTOMERS DESC
LIMIT 5;
 Picture reference: [Project Microsoft Excel Report]
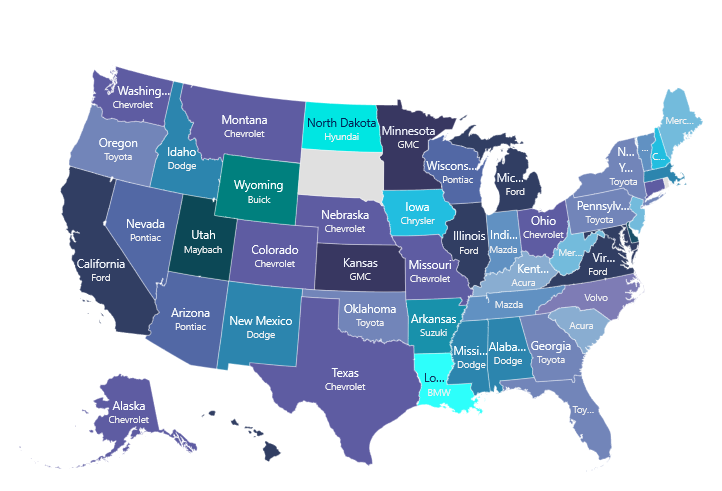
6. Most Preferred Vehicle Make in Each State
- Preferences vary across states, e.g., Alabama prefers Dodge, Alaska prefers Chevrolet, Florida prefers Toyota.
- Some states have ties in customer count for different vehicle makes.
7. Trend of Purchases by Quarter
- Gradual decline in purchases over four quarters, suggesting potential market factors.
- Strong start in Q1 with high purchases; lowest in Q4.
Code Snippet: Quarter-on-Quarter Revenue Change
WITH RevenueByQuarter AS (
    SELECT
        quarter_number,
        SUM(o.VEHICLE_PRICE) AS total_revenue
    FROM
        order_t o
    GROUP BY
        quarter_number
)
SELECT
    quarter_number,
    total_revenue,
    LAG(total_revenue) OVER (ORDER BY quarter_number) AS previous_quarter_revenue,
    (total_revenue - LAG(total_revenue) OVER (ORDER BY quarter_number)) / LAG(total_revenue) OVER (ORDER BY quarter_number) * 100 AS qoq_percentage_change
FROM
    RevenueByQuarter;
8. Quarter on Quarter % Change in Revenue
- Consistent decrease in total revenue, with the highest drop from Q3 to Q4.
Code Snippet: Quarterly Revenue and Order Count
SELECT quarter_number, SUM(vehicle_price) AS Revenue, COUNT(order_id) AS Orders
FROM order_t
GROUP BY quarter_number
ORDER BY quarter_number;
9. Trend of Revenue and Orders by Quarter
- High revenue and order count in Q1; continuous decrease in Q3 and Q4.
- Lowest revenue and order count in Q4, indicating potential challenges.
10. Average Discount Offered by Credit Card Type - Notable range in discount percentages across different credit card types. - Top three credit card types with the highest discount rates: ‘laser’ (64.38%), ‘mastercard’ (62.95%), ‘maestro’ (62.42%).
 Picture reference: [Project Microsoft Excel Report]
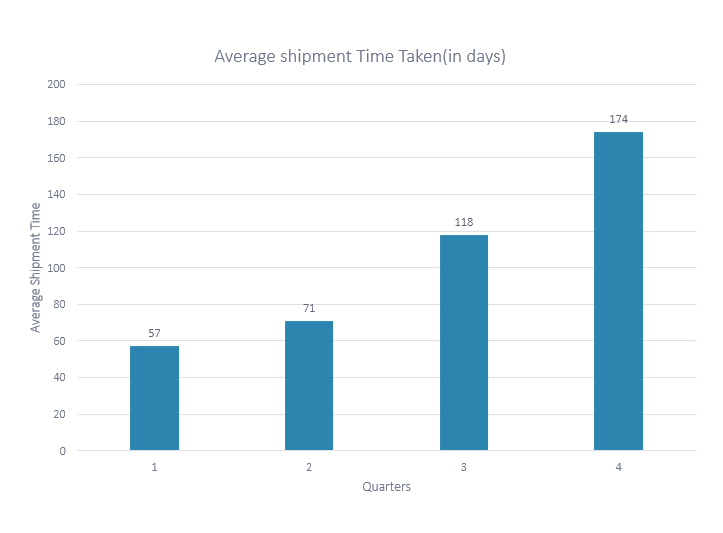
11. Time Taken to Ship Orders by Quarter - Average shipment time consistently increases from 57.17 days in Q1 to 174.10 days in Q4. - Q1 demonstrates a relatively shorter average shipment time, while Q4 shows the longest time.
Recommendations
- Implement targeted marketing campaigns in states with lower customer distribution, focusing on unique selling propositions.
- Conduct thorough analysis of customer feedback, address identified issues promptly, and implement strategies to enhance overall customer satisfaction.
- Implement strategies to enhance overall customer satisfaction, based on feedback analysis.
- Investigate reasons behind declining purchases, adapt marketing strategies, and consider promotional campaigns to stimulate demand.
-
Align discount rates with customer preferences, negotiate favorable terms with credit card companies, and consider targeted promotions.
Above are few recommendations, where this requires further discussion with stakeholders to convert them into action items to be taken further.